Docs / Monitoring
Monitor & Traces
ASAPIO provides a built-in monitoring facility for tracking outbound and inbound message status, inspecting payloads, and retrying failed deliveries.
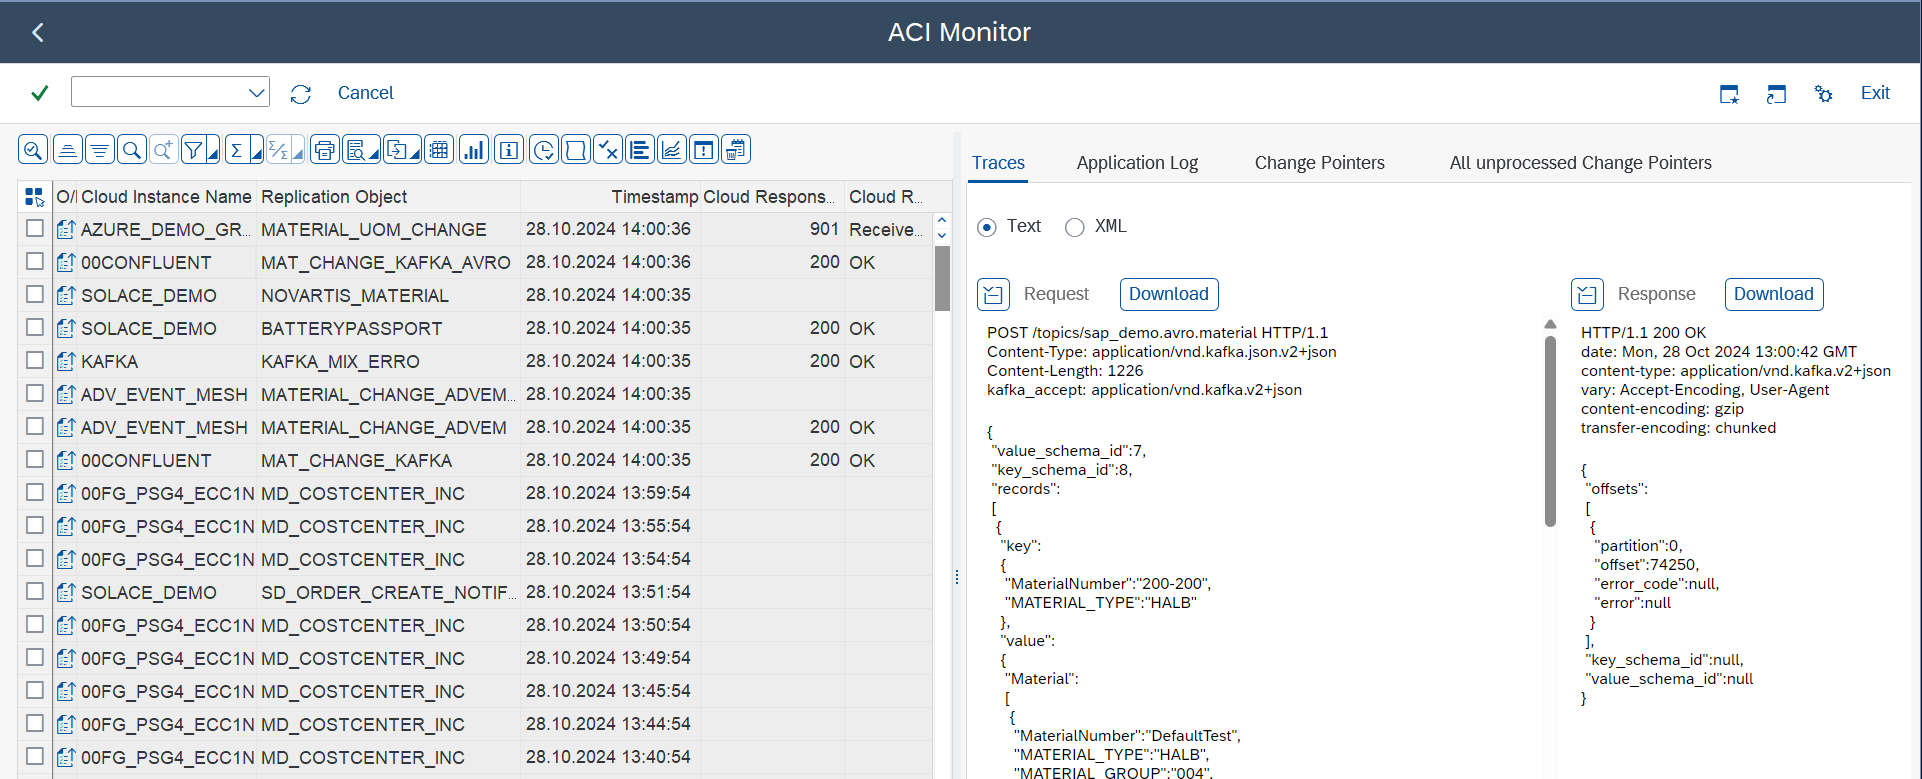
Via SAP GUI
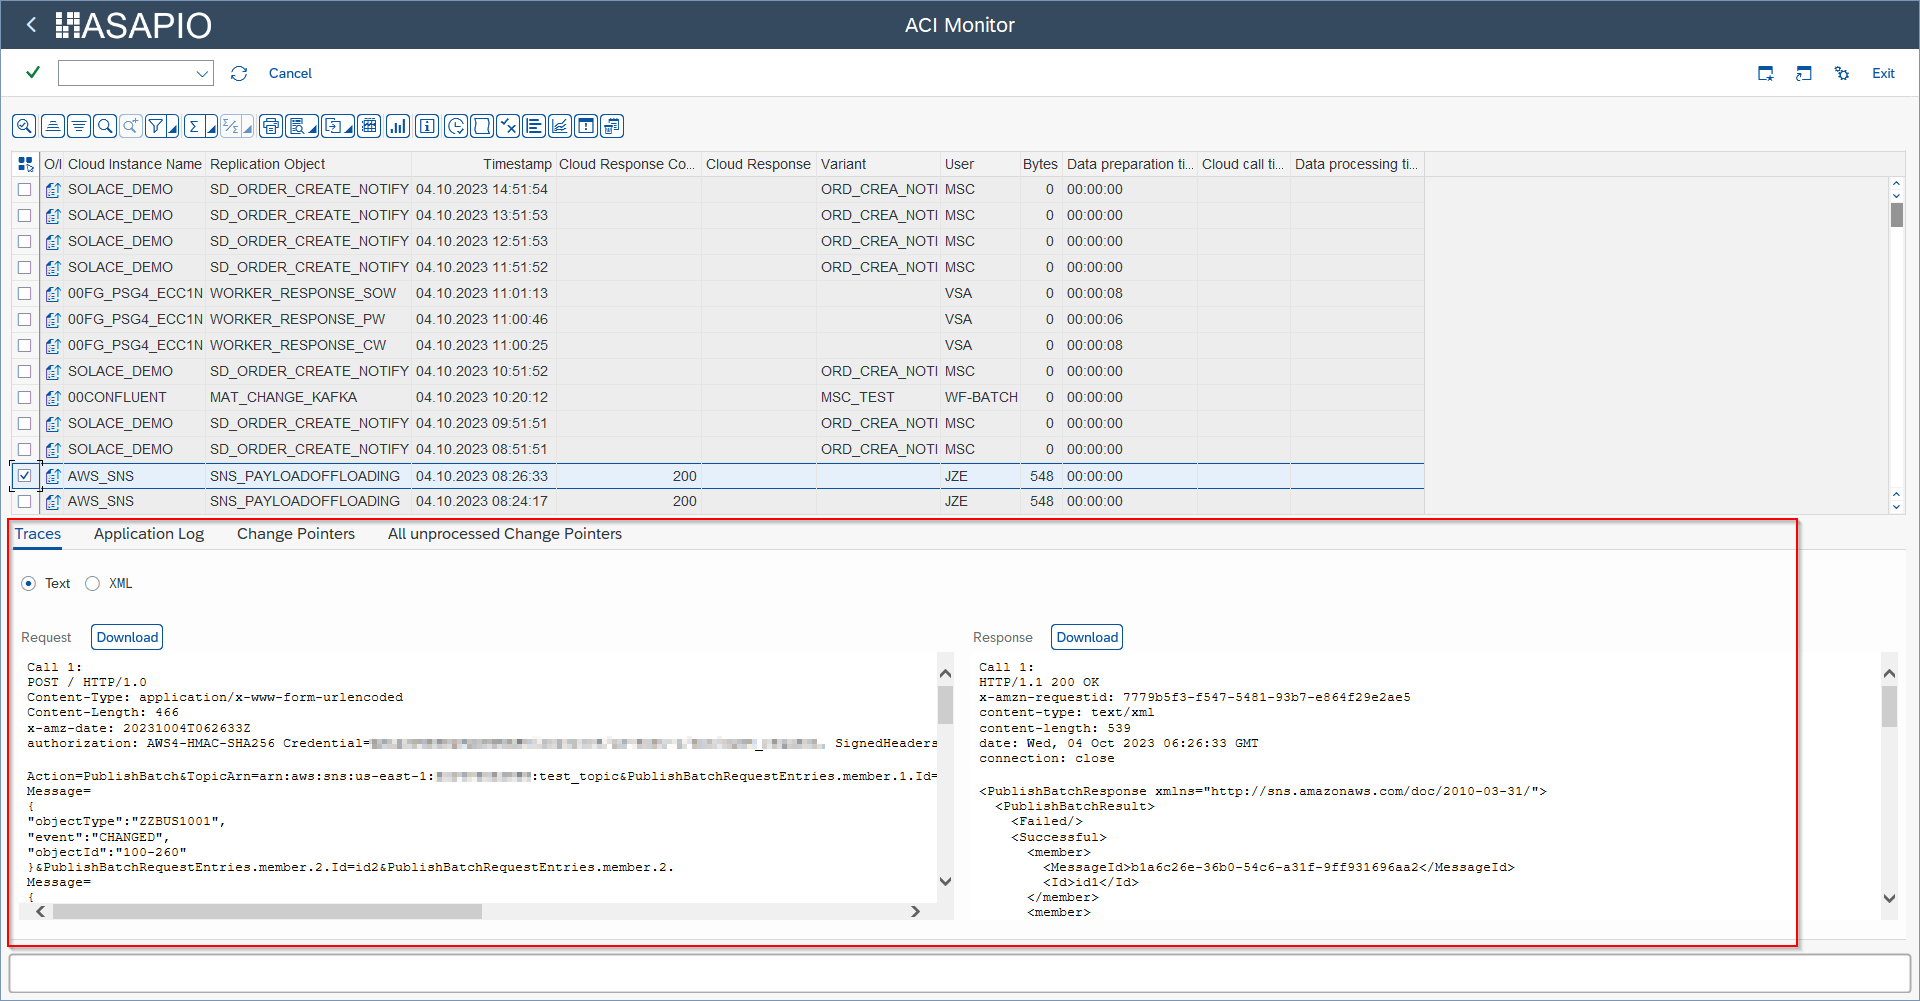
Open transaction /ASADEV/ACI_MONITOR. Filter by date range, object name, status, or connection instance. Select a message to view the full payload, HTTP response code, and error details. Failed messages can be retried individually or in bulk.
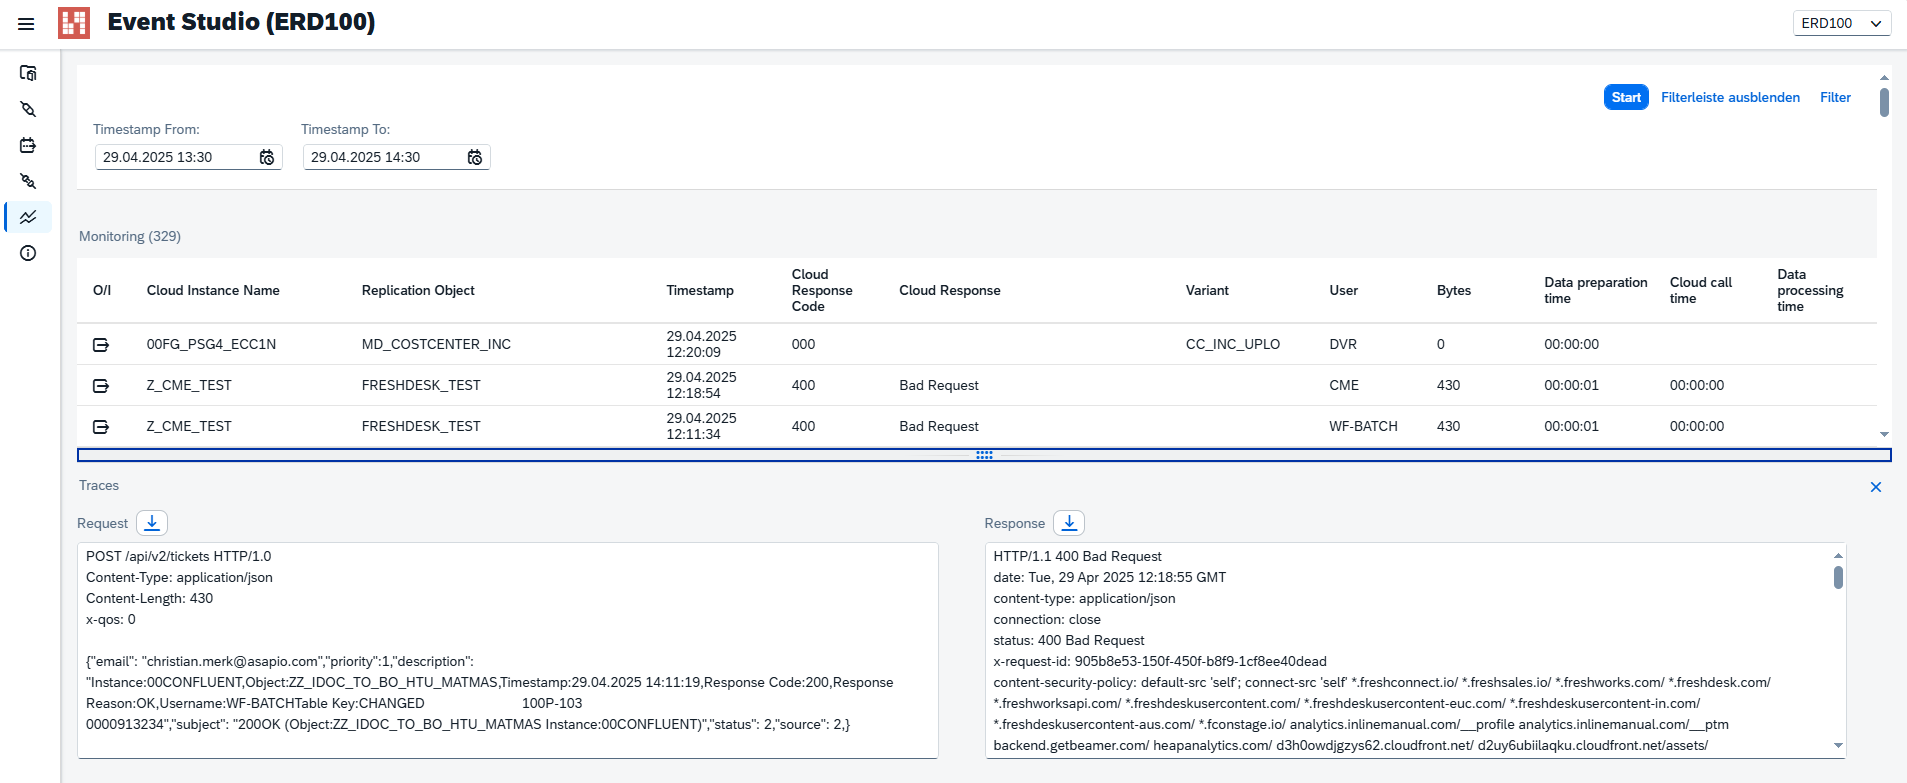
Via Event Studio
The Monitoring section provides the same view with a visual interface. Use the filter bar to narrow by interface, status, or time. Click any row to expand the payload and response details.
Message Statuses
| Status | Description |
|---|---|
| Success | Message delivered and acknowledged |
| Error | Delivery failed — HTTP error or timeout |
| Retry | Scheduled for automatic retry |
| Pending | Queued, not yet processed |
Retry Configuration
Configure in /ASADEV/ACI_SETTINGS → General Settings: Max Retries and Retry Interval (minutes).
Archiving
Schedule job /ASADEV/ACI_ARCHIVE via SM36 to purge old records and maintain performance.
Trace Size Limits (MAXTRACE)
If the MAXTRACE parameter is not maintained on an instance, large payloads can exceed the internal trace size limit. This risks an SAP dump with a runtime error similar to the following:

EXPORT_TOO_MUCH_DATAThe same condition can also cancel a scheduled background job:
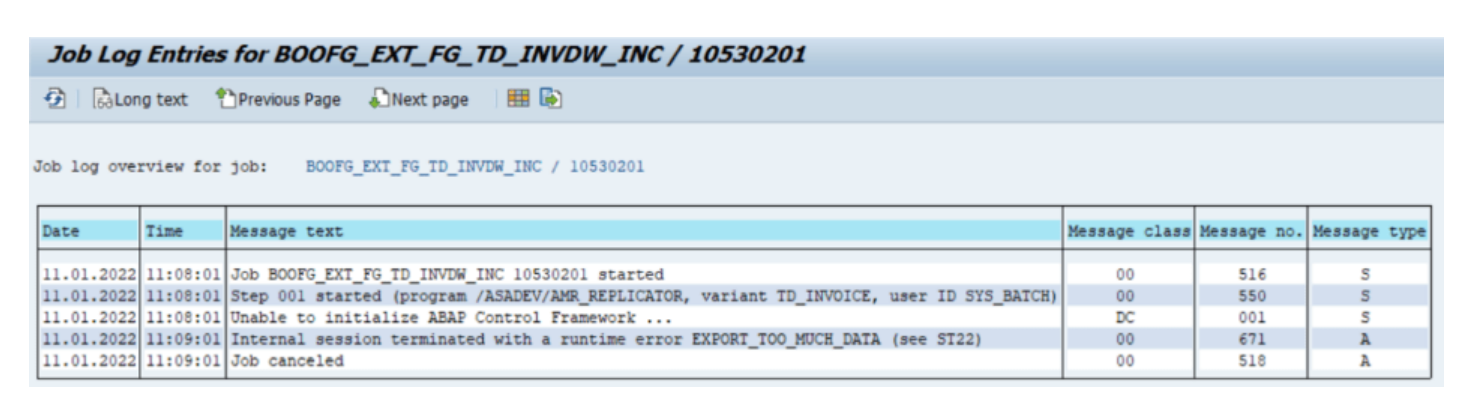
EXPORT_TOO_MUCH_DATA, and the job is cancelledTo prevent this, maintain the MAXTRACE parameter for each instance. Recommended value: 10000.
Configure in /ASADEV/ACI_SETTINGS → Dialog Structure: Connections → Default Values. Select the instance, then set attribute MAXTRACE (or the connector-specific variant, e.g. KAFKA_MAXTRACE) to the recommended value.

MAXTRACE configuration (example: KAFKA instance)BAL Log Severity Filter
Control the minimum severity that gets persisted to the application log (SLG1) for logging that goes through the central BAL wrapper class. By default, every message (success, info, warning, error, abort) is logged; raising the threshold reduces log volume and the load on the application log's number range.
| Table | GLOB_CONST | Valid values | Default |
|---|---|---|---|
/ASADEV/ACI_PAR | BAL_LOG_MIN_SEVERITY | S, I, W, E, A | I (if unmaintained – logs everything, i.e. unchanged behavior) |
Activate the filter in two steps, in this order:
- In table
/ASADEV/ACI_PART(the value-help table for/ASADEV/ACI_PAR), via SM30, add a new entry withGLOB_CONST = BAL_LOG_MIN_SEVERITY. Without this entry, the parameter is not selectable in step 2. - In
/ASADEV/ACI_PAR, via SM30, create an entry forBAL_LOG_MIN_SEVERITYand set the minimum severity to persist.
For example, a threshold of E persists only Error and Abort messages – Success, Info and Warning messages are dropped and never reach SLG1. If no message survives the filter, the log header itself is not saved either.