Docs / Monitoring
Monitor & Traces
ASAPIO provides a built-in monitoring facility for tracking outbound and inbound message status, inspecting payloads, and retrying failed deliveries.
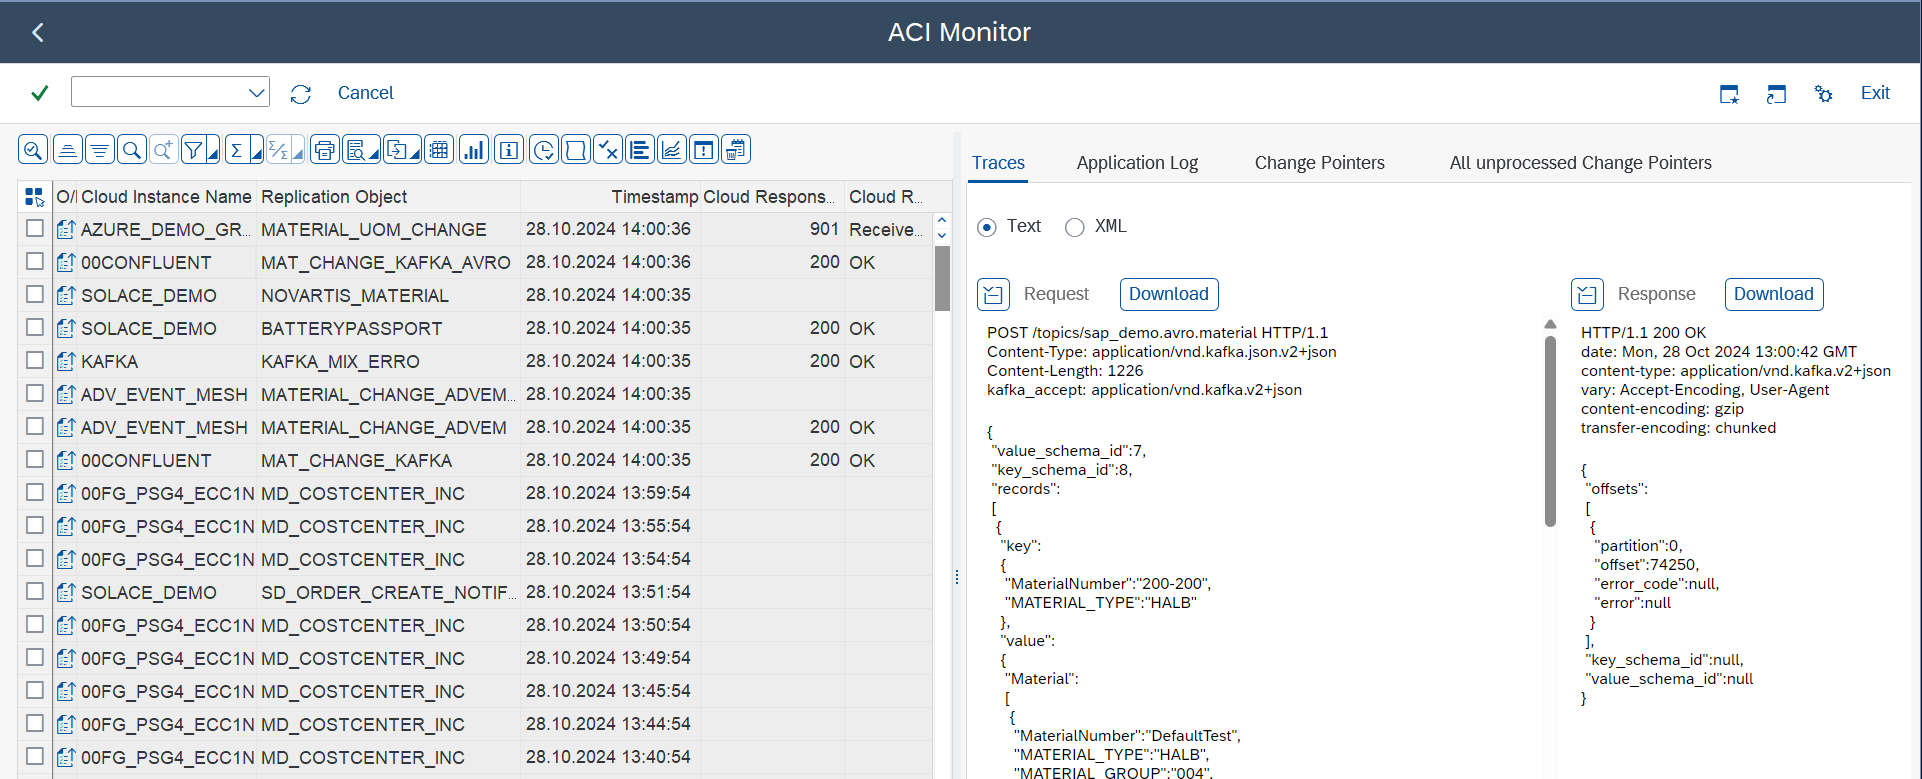
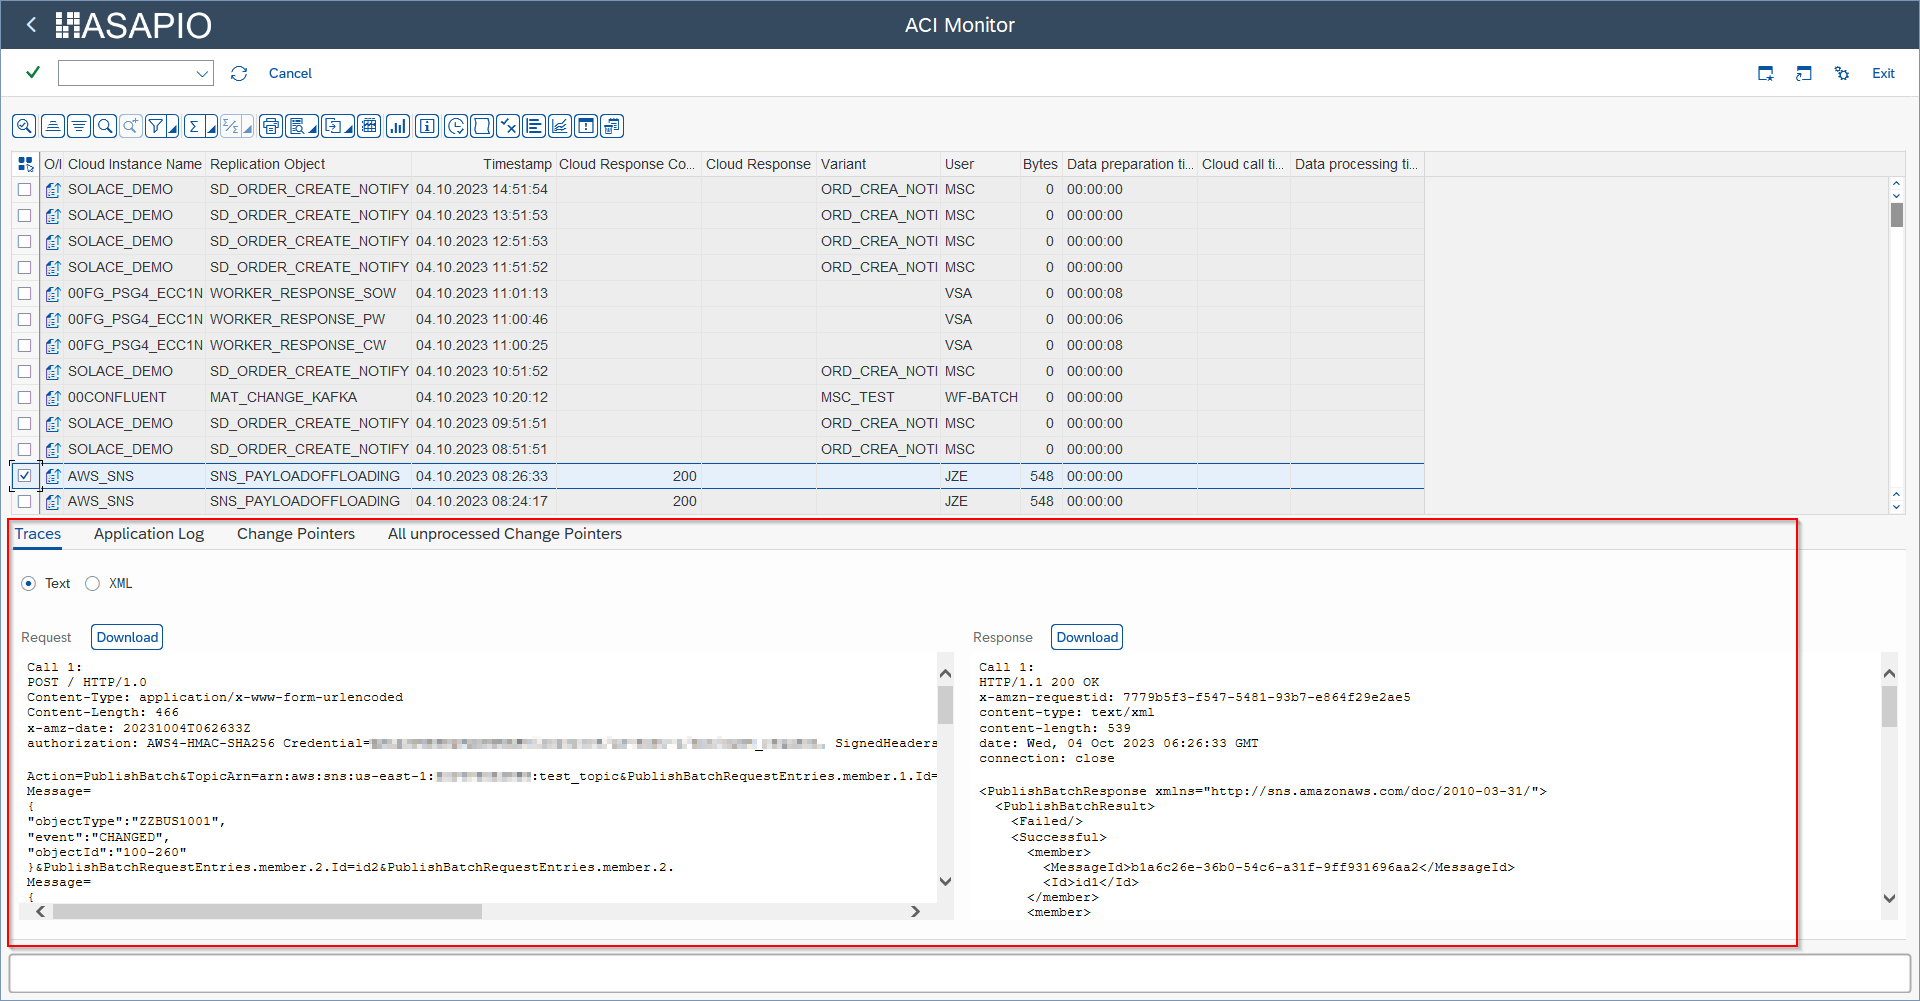
Via SAP GUI
Open transaction /ASADEV/ACI_MONITOR. Filter by date range, object name, status, or connection instance. Select a message to view the full payload, HTTP response code, and error details. Failed messages can be retried individually or in bulk.
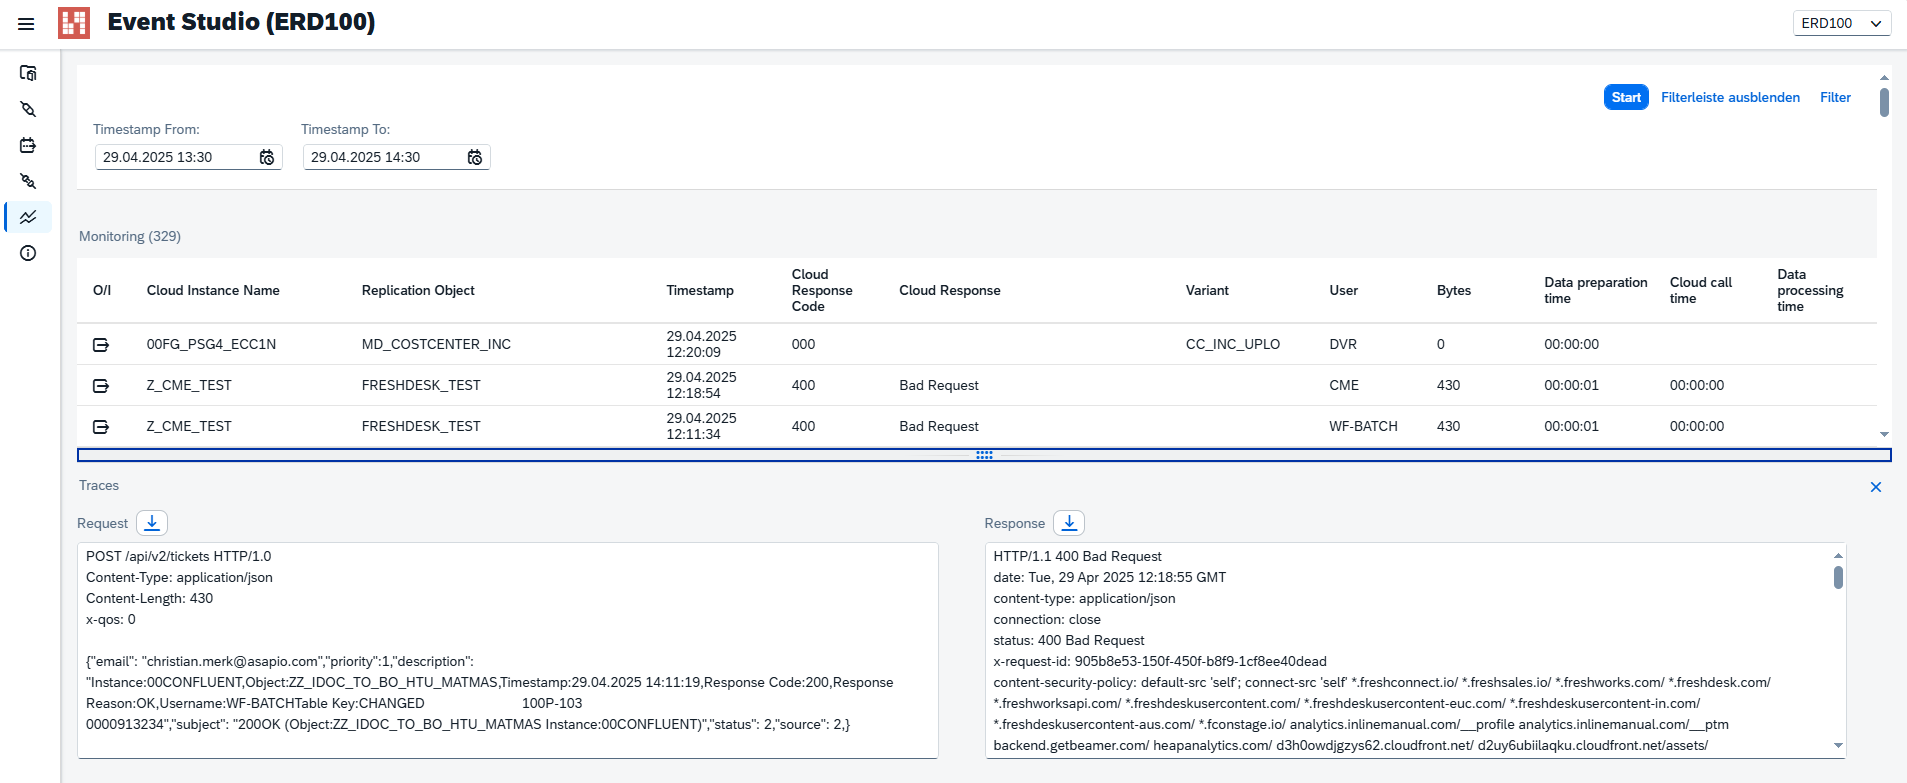
Via Event Studio
The Monitoring section provides the same view with a visual interface. Use the filter bar to narrow by interface, status, or time. Click any row to expand the payload and response details.
Message Statuses
| Status | Description |
|---|---|
| Success | Message delivered and acknowledged |
| Error | Delivery failed — HTTP error or timeout |
| Retry | Scheduled for automatic retry |
| Pending | Queued, not yet processed |
Retry Configuration
Configure in /ASADEV/ACI_SETTINGS → General Settings: Max Retries and Retry Interval (minutes).
Archiving
Schedule job /ASADEV/ACI_ARCHIVE via SM36 to purge old records and maintain performance.